Texas Veterans in 2024: A Data-Driven Analysis of Demographics, Education, Labor, and Disability
Background
Veterans are a sect of the population that previously served on active duty in the United States (U.S.0 armed forces and were civilians at the time of their survey (U.S. Bureau of Labor Statistics, 2025a). The veteran population is not evenly distributed across the nation. Veterans represent a significant and distinct population within Texas. Understanding their demographic composition, geographic distribution, education attainment, labor market participation, and disability prevalence is essential for workforce planning, public policy, and service design.
The project uses 2024 IPUMS American Community Survey (ACS) microdata to examine veterans in Texas at the state level and builds upon existing research from the Texas Workforce Investment Council. The central research question is:
How do Texas veterans differ from nonveterans in geography, education, employment, earnings, and disability status?
H0: Texas veterans do not differ from nonveterans in geography, education, employment, earnings, and disability status.
HA: Texas veterans differ from nonveterans in geography, education, employment, earnings, and disability status.
Methodology
Data Sources and Materials
This project uses:
IPUMS USA 2024 ACS microdata
Texas geographic identifiers
Survey weights for population estimation
R software for data cleaning and aggregation
Figma and Flourish for visualization design and narrative layout
Data Processing Workflow
1: Defining an extract from IPUMS and querying data using an API key
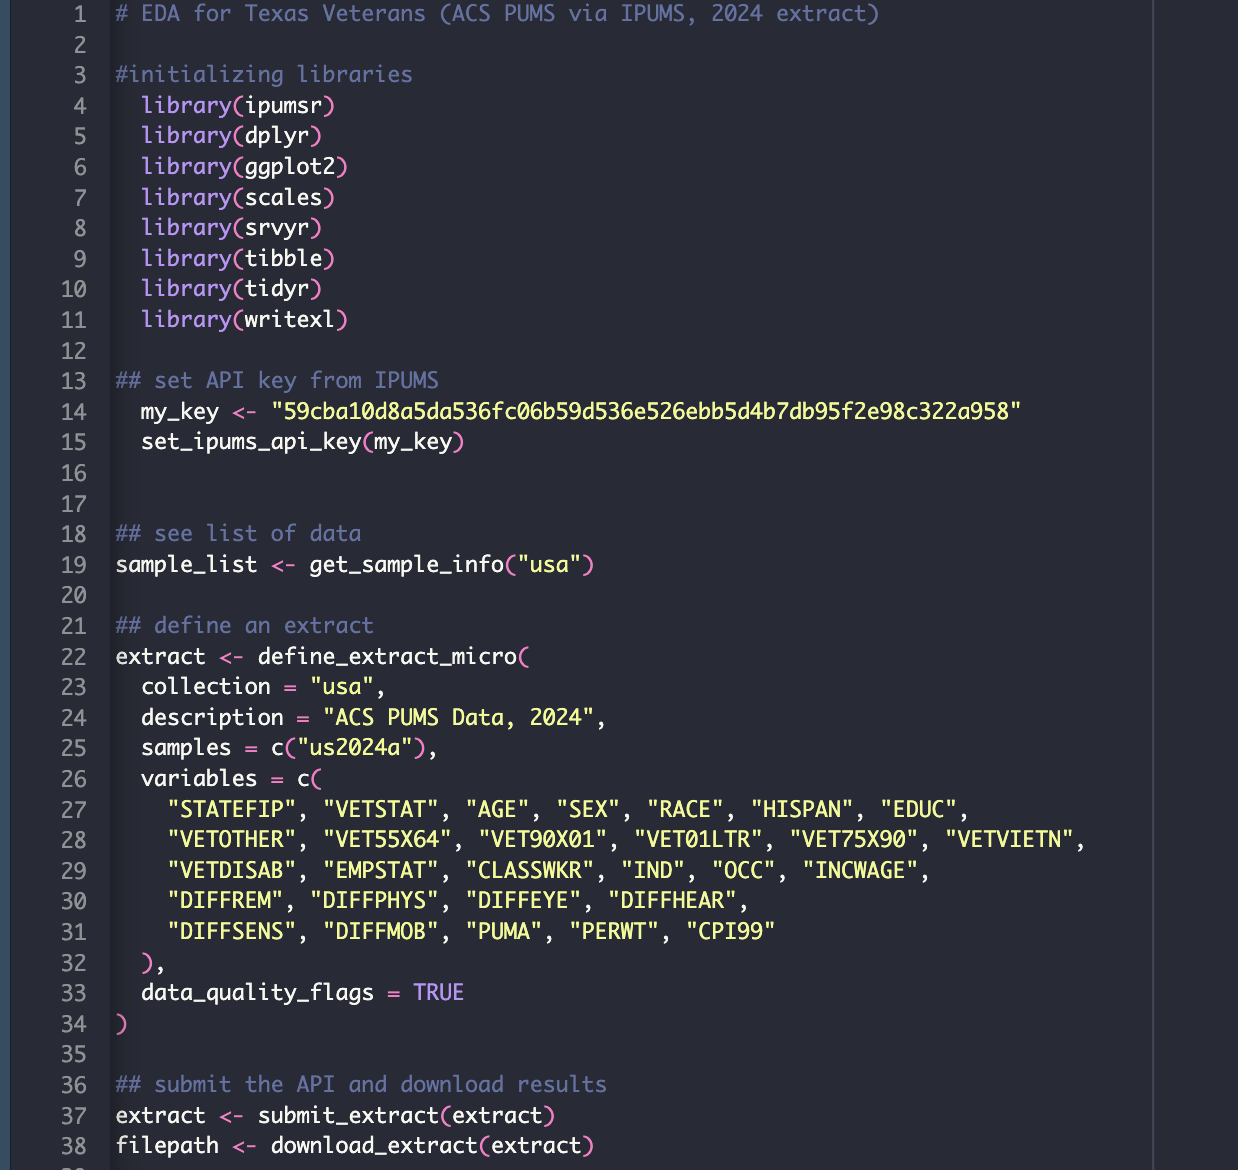
2: Defining variables and filtering for Texas
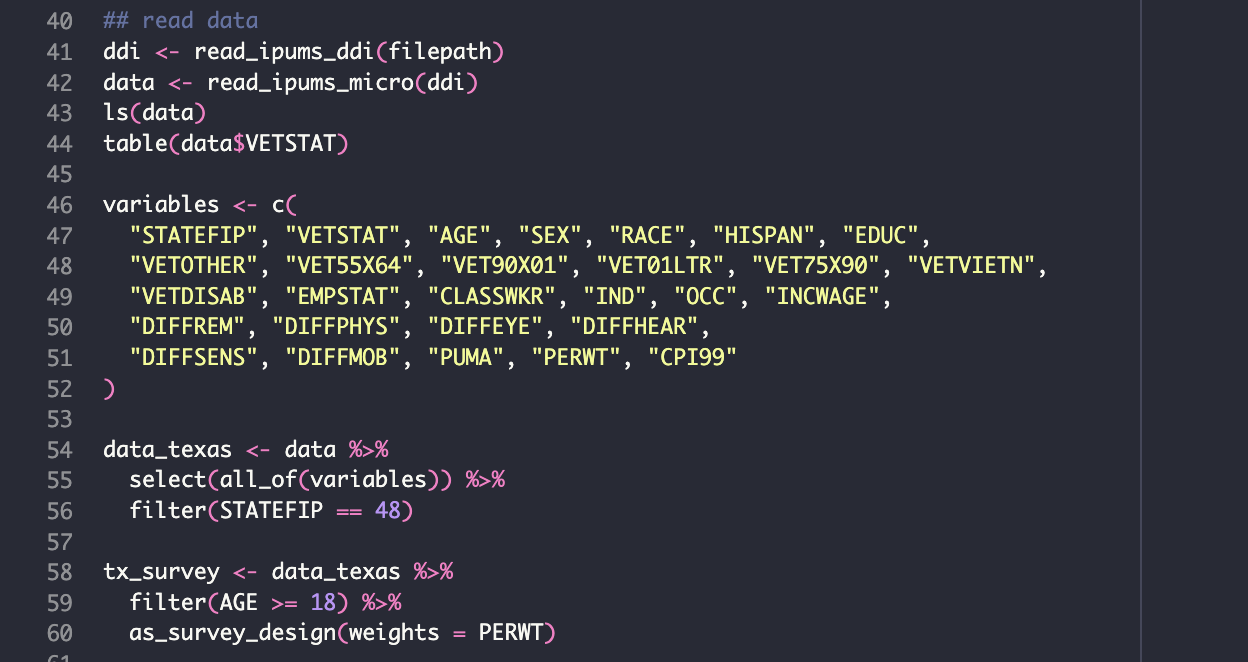
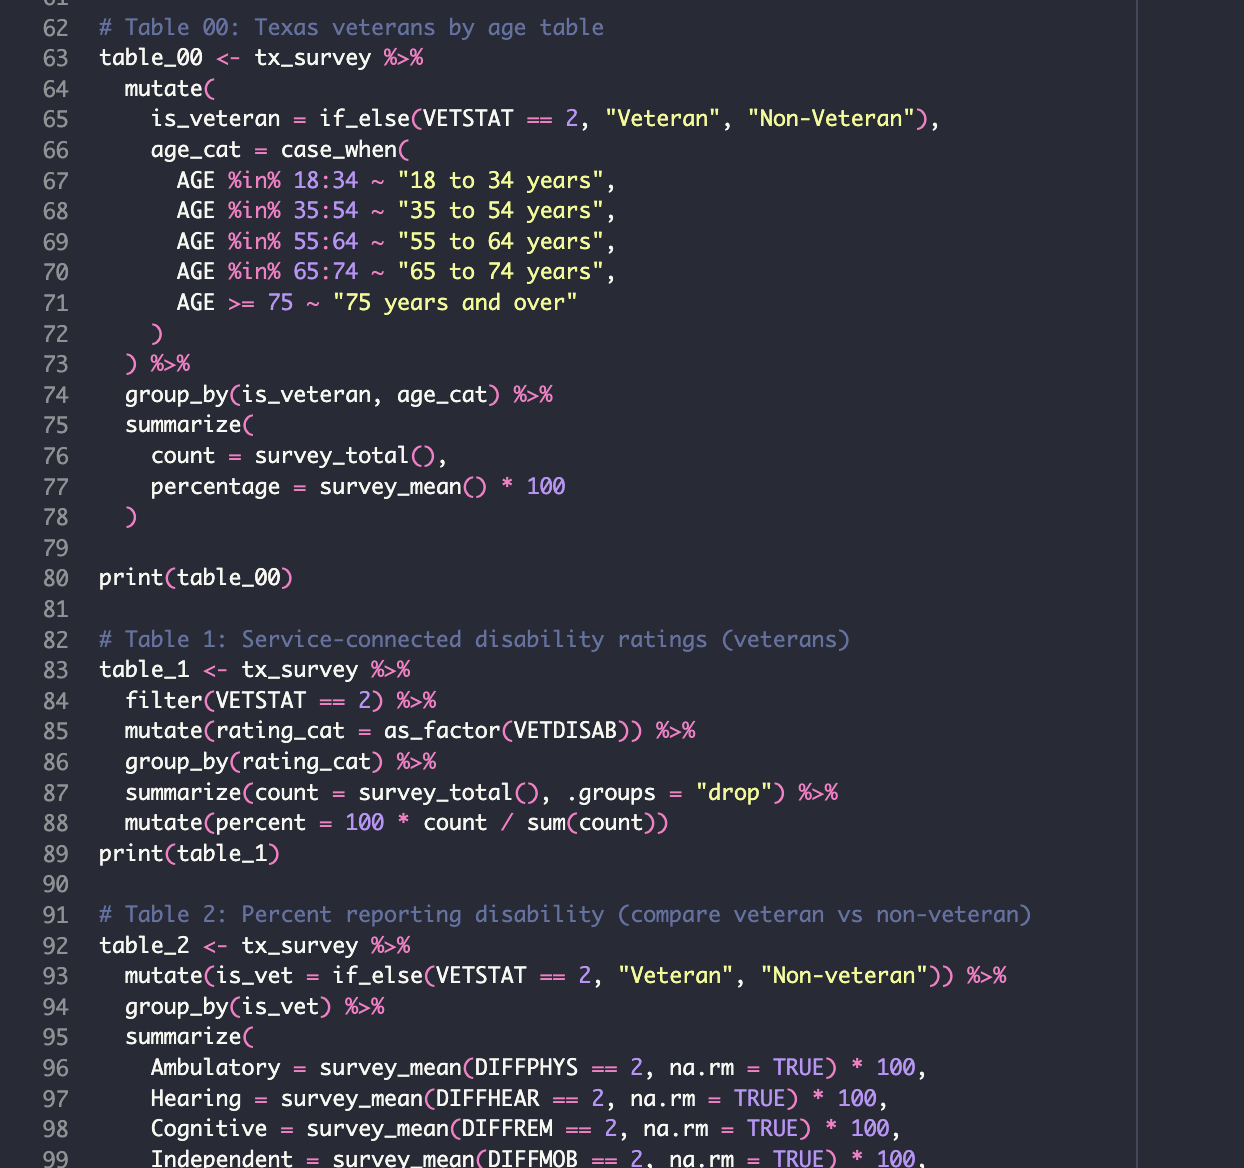
3: Creating tables to view relationships between variables and for future creation of visualizations
4: Running a Poisson Regression Model to see if certain variables could predict where veterans were likely to live
5: Structured Results into visualizations using Flourish and creating a Figma site for presentation
Results and Interpretation
1: Geographic Distribution
Veterans in Texas are distributed statewide but are concentrated in major metropolitan counties and bases.
2: Demographic Structure and Educational Attainment
The veteran population differs significantly from nonveterans in age structure. Veterans are older on average ( a large portion is 55 and older). Veterans show strong postsecondary education attainment with higher rates of some college or associate degrees.
3: Labor Force Participation and Earnings
Half of Texas veterans participate in the labor force across both private and public sectors. Representation is strong in construction, public safety, healthcare, education, and technical occupations. Veterans are employed in managerial and skilled roles at notable rates, and their income increases substantially with educational attainment.
4: Disability Prevalence
Disability is more common among veterans than nonveterans. Veterans report higher rates of ambulatory and hearing difficulties. Disability prevalence increases with age.
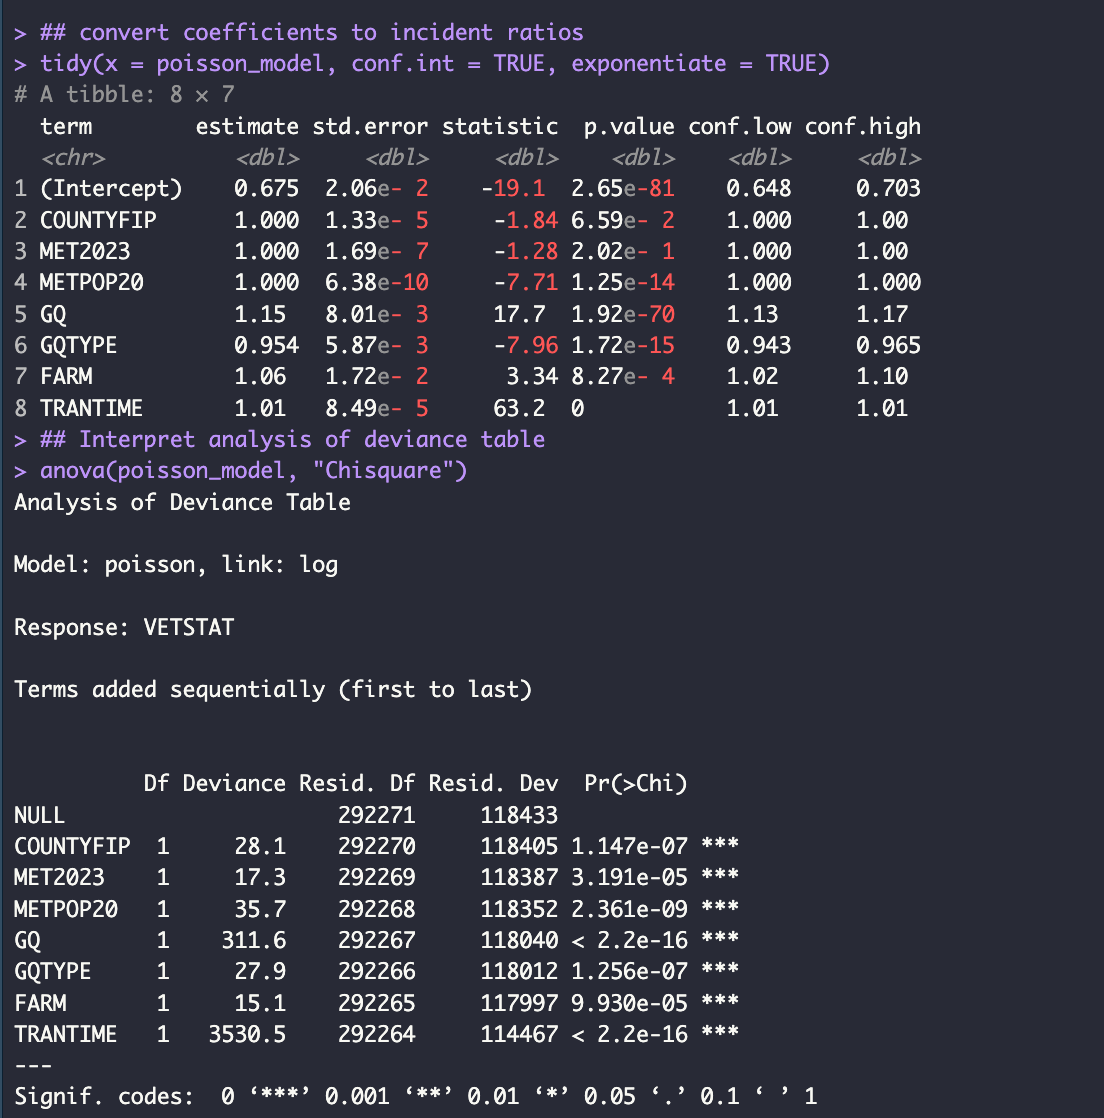
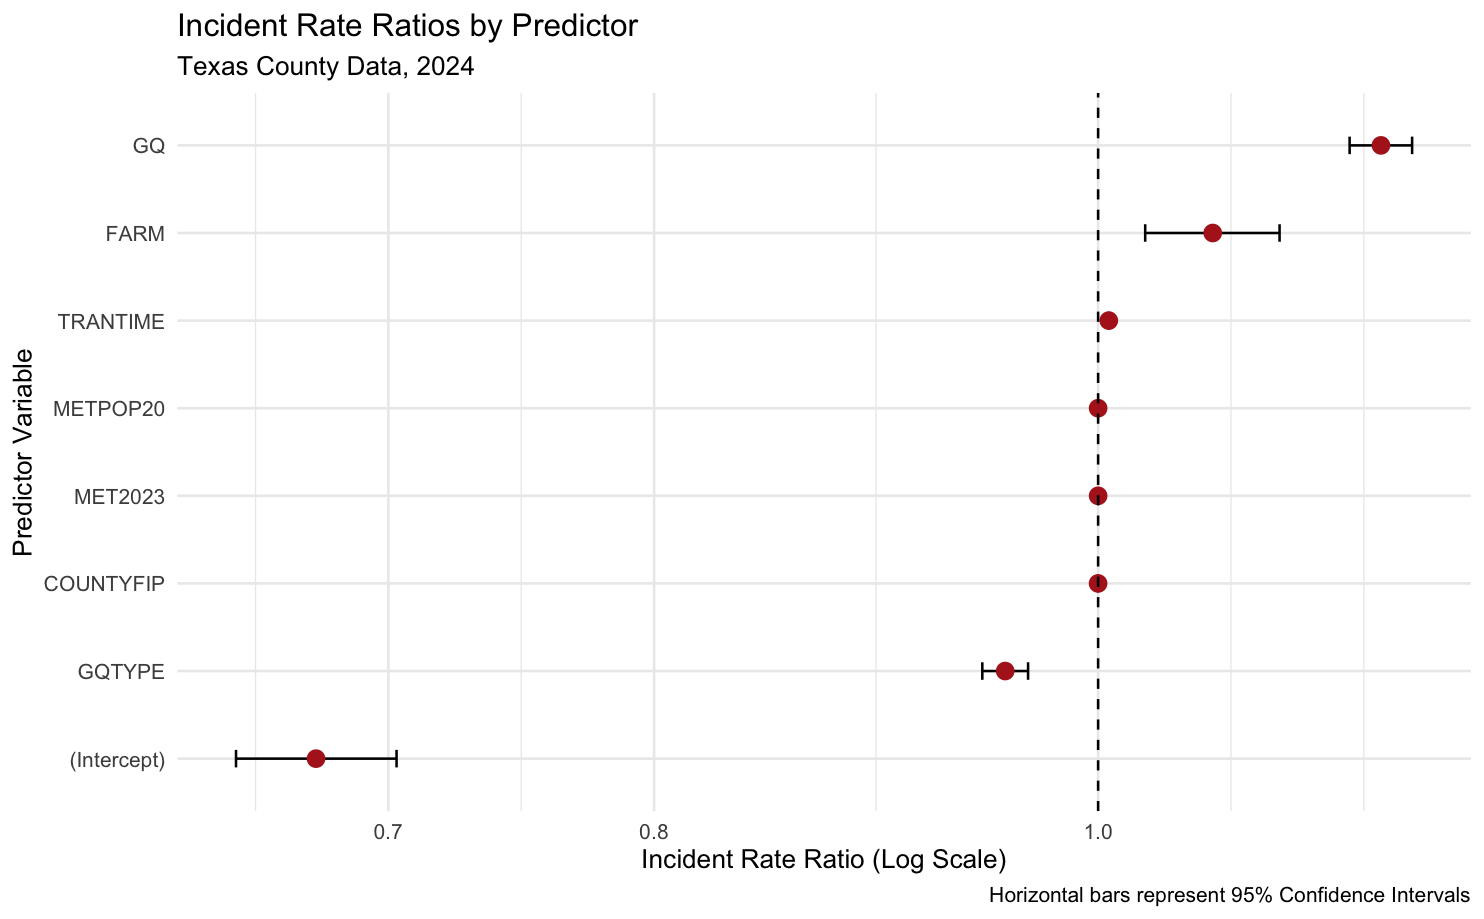
5: Poisson Regression Modeling
For the Poisson regression model, I ran the following variables to assess whether they were associated with the VETSTAT (veteran status) variable. The variables were METPOP2023 and METPOP20 (metropolitan population), GQ (group quarters: spaces like prisons, bases, any kind of group housing), FARM (near an area or land designated as farm use) and TRANTIME (transit time to metropolitan area). All variables in the model indicate a significant relationship with the veteran status outcome variable. Group quarters have the strongest positive effect. For every one-unit increase in Group Quarters, the expected count of veterans increases by 15%. For areas classisfied as “Farm” the expected count of variables increases by 6%.
The model would have had a better fit if I had excluded the COUNTY and METPOP variables. The model predicted that living in a group quarter or near a farm where the strongest predictors of veteran status in Texas counties.
Reflections
Through this project I learned that large-scale survey data requires careful weighting and interpretation to appropriately assess metrics. Demographic structure has to be considered before drawing labor conclusions and future policy implications should emerge naturally from the data rather than being imposed. In some areas of life it is very clear that veterans and nonveterans are different, but they aren’t so dissimlar that I can completely reject my null hypothesis.
This project could be expanded in several ways:
Conducting additional predictive modeling of earnings predictors and labor force participation
More intersectional analysis of education, disability, and gender
Regional analysis across counties
Multi-year trend comparison
Conclusion
This project provides a comprehensive analysis of Texas veterans across demographic, educational, labor, geographic, and disability dimensions. The findings demonstrate that veterans in Texas are geographically widespread, older than nonveterans, have strong educational attainment, participate actively in the workforce and work across diverse industries and occupations. Veterans represent both an experienced workforce and a population with evolving service needs.